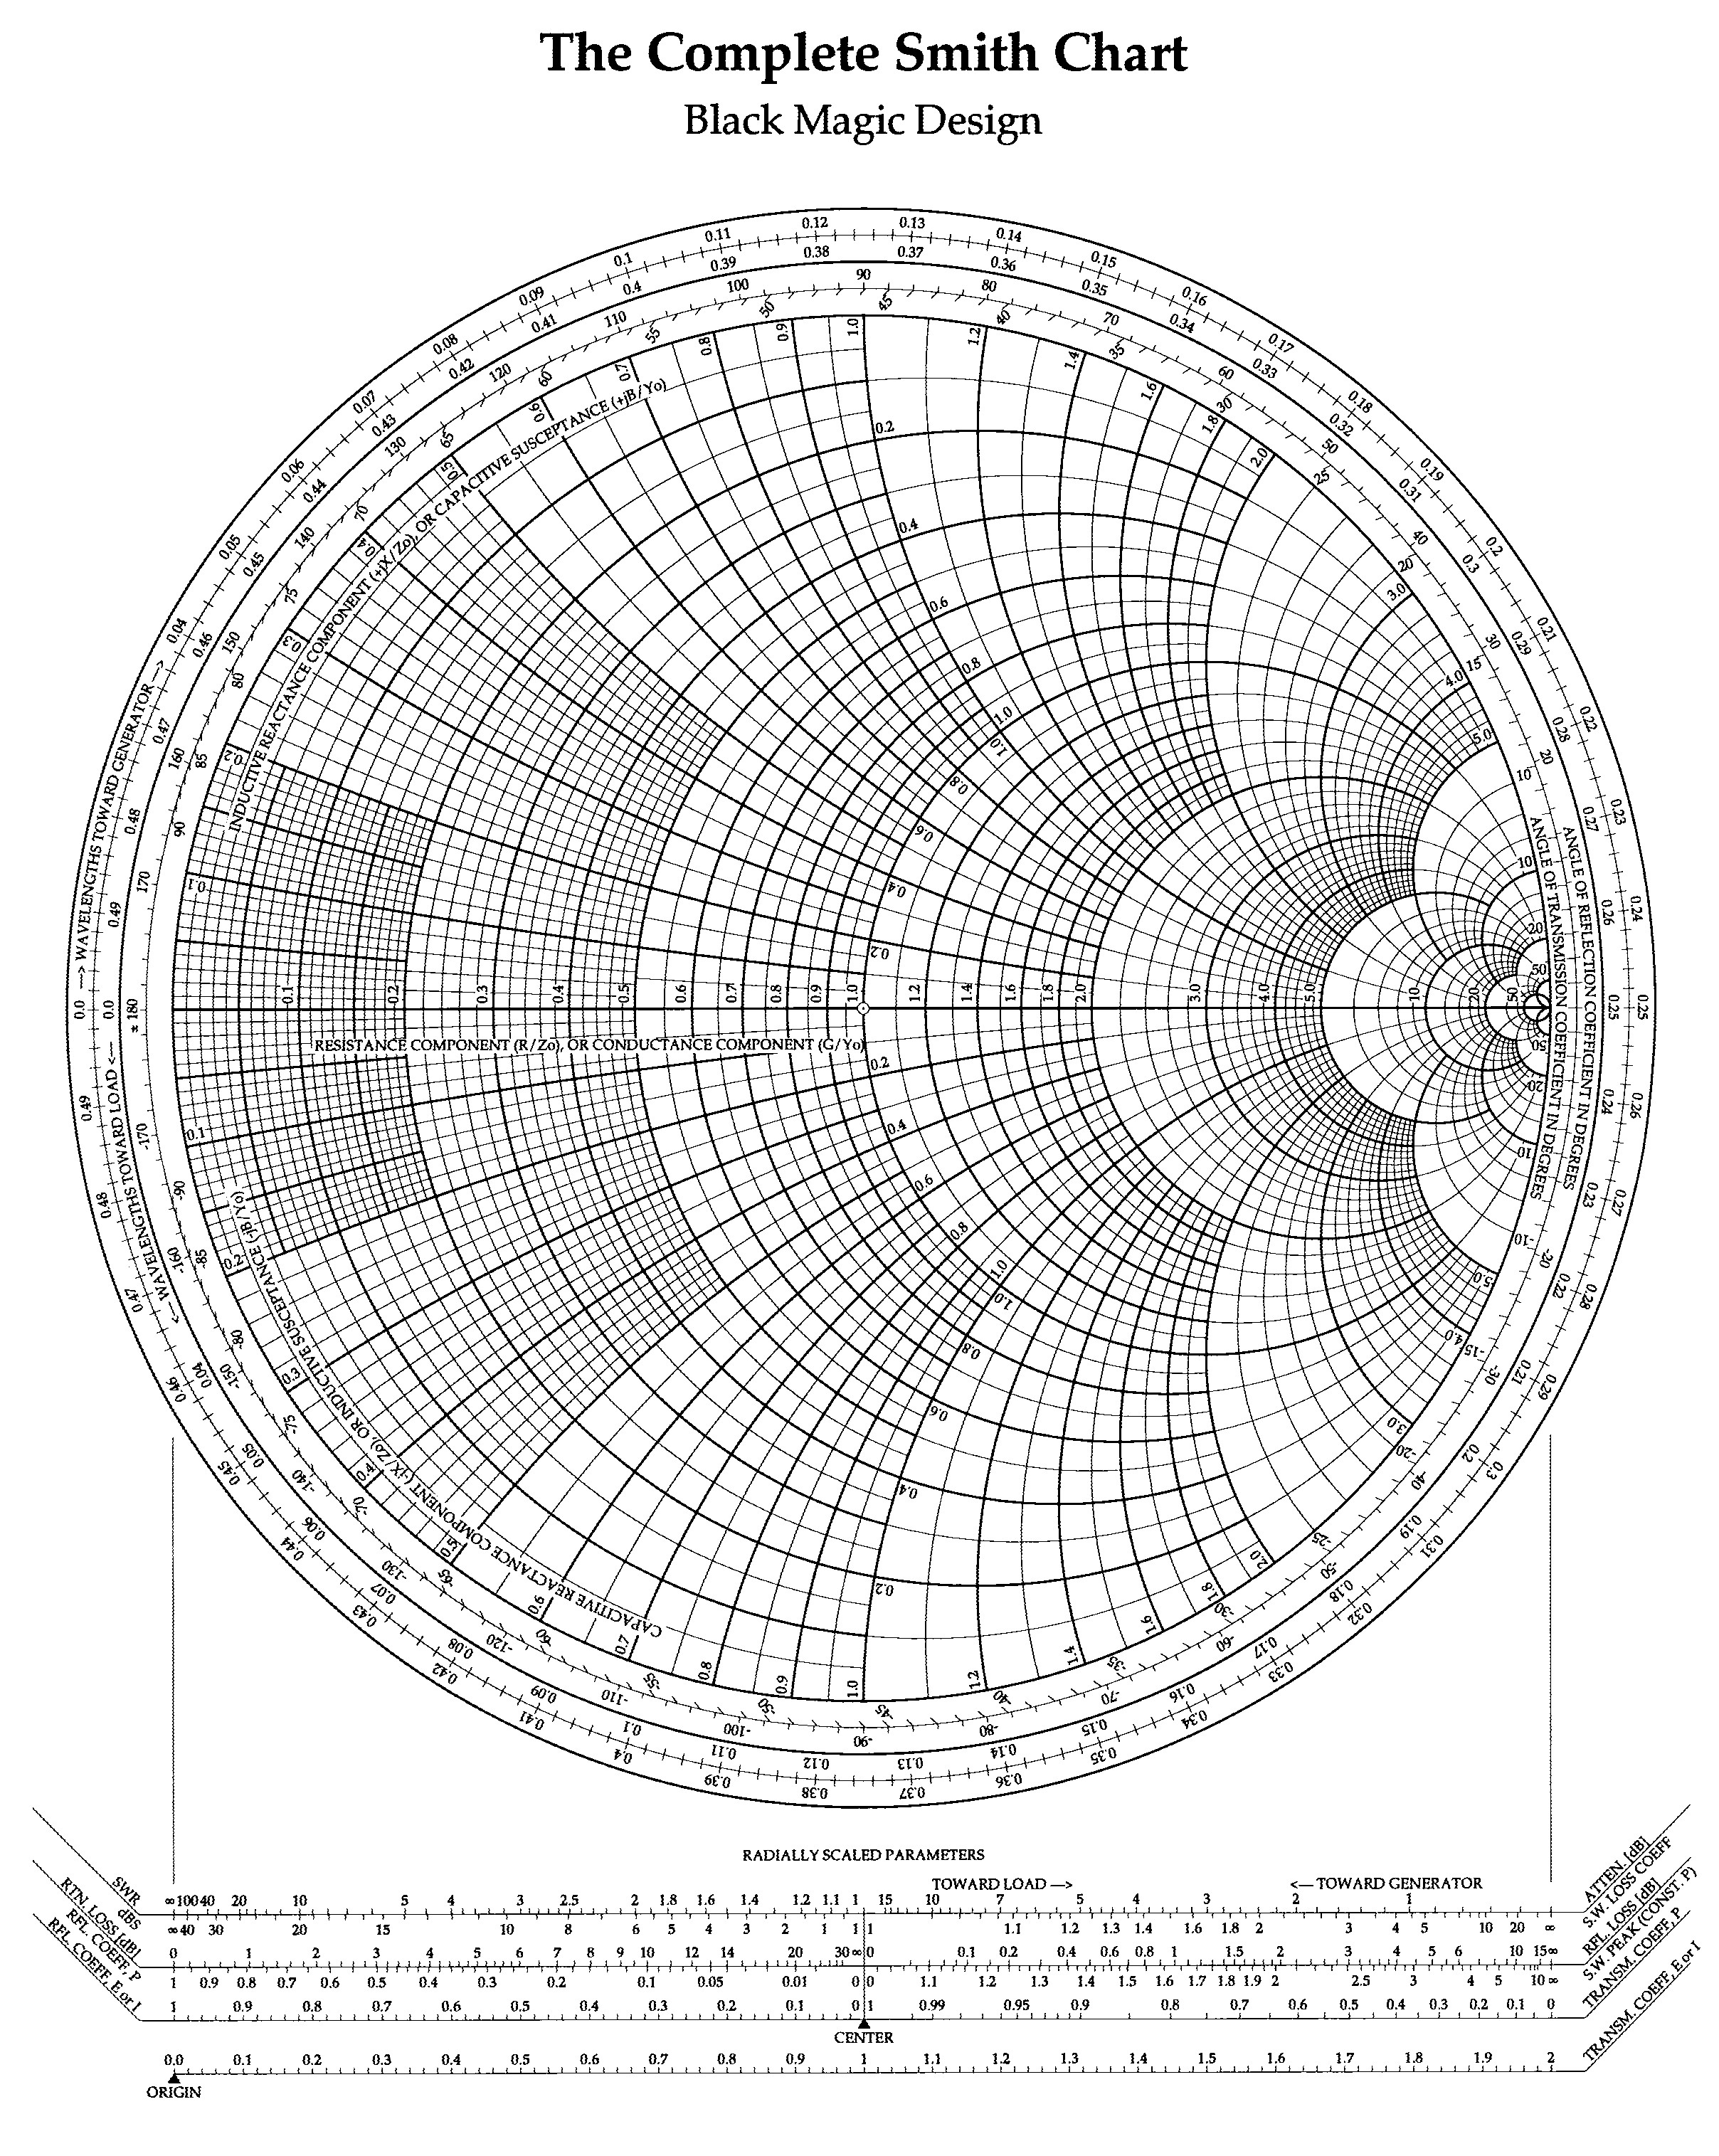
Reference: SmithScales, PeripheralScales.
Mount SmithScales independently so its twelve axes stay outside chart zoom:
import { SmithScales, SmithEventType } from 'smithkit';
const scales = new SmithScales();
scales.draw('#smith-scales'); // Provide a separate mounted container.
const stopScales = chart.onEvent((event) => {
if (event.type === SmithEventType.Cursor || event.type === SmithEventType.Marker) {
const gamma = event.data?.reflectionCoefficient ?? null;
scales.update(gamma);
chart.peripheralScales.update(gamma);
}
});
// On unmount: stopScales(); scales.destroy(); chart.destroy();
update(Complex | null) synchronizes indicators, values, tooltips, and accessible
labels. Null, non-finite, or active-load inputs hide indicators. draw accepts a
selector or HTMLElement; destroy is idempotent. Scales adapt to container width.
Labels follow the complete Smith chart terminology: Reflection loss, Power reflection coefficient, Power transmission coefficient, and separate Voltage transmission coefficient and Current transmission coefficient. Ratios are dimensionless; loss/standing-wave dB axes are in dB. Transmission indicators depend on Γ phase as well as magnitude.
Attenuation is −10 log₁₀|Γ|, half the return loss. Its one-way loss interpretation assumes a matched line or attenuator terminated in an open or short: the reflected wave traverses it twice. It does not measure insertion loss of an arbitrary load from S11 alone. At |Γ| = 0.1 it reads 10 dB, while return loss reads 20 dB.
Peripheral rulers are hidden by default. Enable them with
{ peripheralScales: { visible: true } } or chart.peripheralScales.setVisible(true).
Axis captions and numeric tick labels can be controlled independently, through the
constructor, setOptions(), or the peripheral scale controls:
import { Smith } from 'smithkit';
const chart = new Smith({
peripheralScales: { visible: true, captionsVisible: false, tickLabelsVisible: true },
});
chart.draw('#smith');
chart.setOptions({ peripheralScales: { captionsVisible: true } });
chart.peripheralScales.setTickLabelsVisible(false); // Captions and rulers remain visible.
chart.peripheralScales.setCaptionsVisible(false); // Rulers and indicators remain visible.
Both text options default to true; the entire group remains hidden by default.
When captions are hidden, numeric labels fill the sectors normally reserved for them.
Hiding/re-showing the rulers preserves both preferences. Text controls do not affect
ruler lines, ticks, indicators, grid labels, or the independent radial parameter scales.
SVG/PNG exports preserve the current text visibility. The demo exposes Axis captions
and Tick values checkboxes in Chart settings.
chart.peripheralScales.update(Complex | null) supplies or clears the indicators.
Its four rulers zoom with the chart: reflection phase, voltage transmission phase,
wavelengths toward generator, and wavelengths toward load. Wavelength rulers start
at the negative real axis, with 0.5 λ per revolution (generator clockwise, load
counterclockwise). These are electrical-length coordinates modulo 0.5 λ.
Reflection phase and wavelength coordinates are undefined at perfect match;
transmission phase is undefined at Γ = −1.
Scale conventions follow the complete Smith chart reference and CERN's Smith chart introduction.